April 6, 2025
News
News

Liberation Day, uplifting economic data from the US, and cooling eurozone inflation

Carry trades 101 and what enabled - and ended - the yen carry trade

.png)
In early August of this year, the global financial markets experienced some of the biggest and most violent crashes we’ve seen since COVID-19 broke out and caused a mass panic across the globe.
The Japanese Nikkei 225 index got hit particularly hard, plummeting 12.4% on August 5 for its biggest one-day decline since Black Monday in 1987.
We had gotten some less-than-great economic data in the days prior, sure. Warren Buffet had also been out selling stock which is never an encouraging sign. But those things weren’t nearly enough to explain the sell-offs we saw.
Analysts and investors quickly began pointing to the yen carry trade as the culprit. Or rather, the unwinding of the yen carry trade.
So what happened? What even is a carry trade? And more importantly, should we be worried about it moving forward? I wrote a brief summary of the situation in my weekly newsletter back then but will do a deeper dive below.
Carry trades are simple, powerful, and extremely popular among institutional investors. Here’s essentially how you’d do a carry trade 👇
To sum up the carry trade: An investor borrows money in a country with low interest rates and a weakening currency, converts the money to a stronger currency, and invests the money in assets with a higher yield than their borrowing cost.
With that brief introduction to the fundamental structure of carry trades, let’s take a closer look at the yen carry trade itself. Specifically, let’s take a look at the series of events and phases that led up to the market crash in early August.
Most developed countries have had unusually low rates since the Great Financial Crisis in 2008. Japan has been on another level though.
Ever since 1995, Japan’s leading interest rate has been no higher than 0.5%. From January 2016 through 2023, interest rates in Japan were even negative.
For comparison’s sake, when the US lowered its interest rate to 0.25% in late 2008, it was the first time ever that it was below 1%. And even then, it never went below 0.25%.
Rates in the EU have generally been lower than in the US and even went negative from 2014 to 2022. They haven’t been as consistently low as in Japan though.
The extremely low rates in Japan laid the foundation for the yen carry trade. They enabled investors to borrow yen at a very low cost and put the money to work elsewhere.
February 2022 to July 2024
In early 2022, the US Federal Reserve began an aggressive rate hiking cycle. The European Central Bank followed a few months later. Their goal was to combat inflation which was running at 9 - 10% at the time.
In just a year and a half, the US raised interest rates from 0.25% to 5.5%. The EU went from -0.5% to 4% in the same period.
This caused treasury bond yields to rise. The US 2-year bond yielded as little as 0.1 to 0.2% in 2020 and 2021 before starting to climb on expectations of higher rates. It quickly rallied above 4% in late 2022 and stayed close to 5% until earlier this year.
Meanwhile, inflation in Japan was barely above target. In fact, the inflation rate only peaked in January 2023 at 4.3% before quickly dropping back to 3.3% the following month. And this came after decades of low inflation.
Because of this, Japan saw no reason to join the rate hiking cycle. On the contrary, the BOJ kept rates unchanged at -0.1% from 2016 to March 2024.
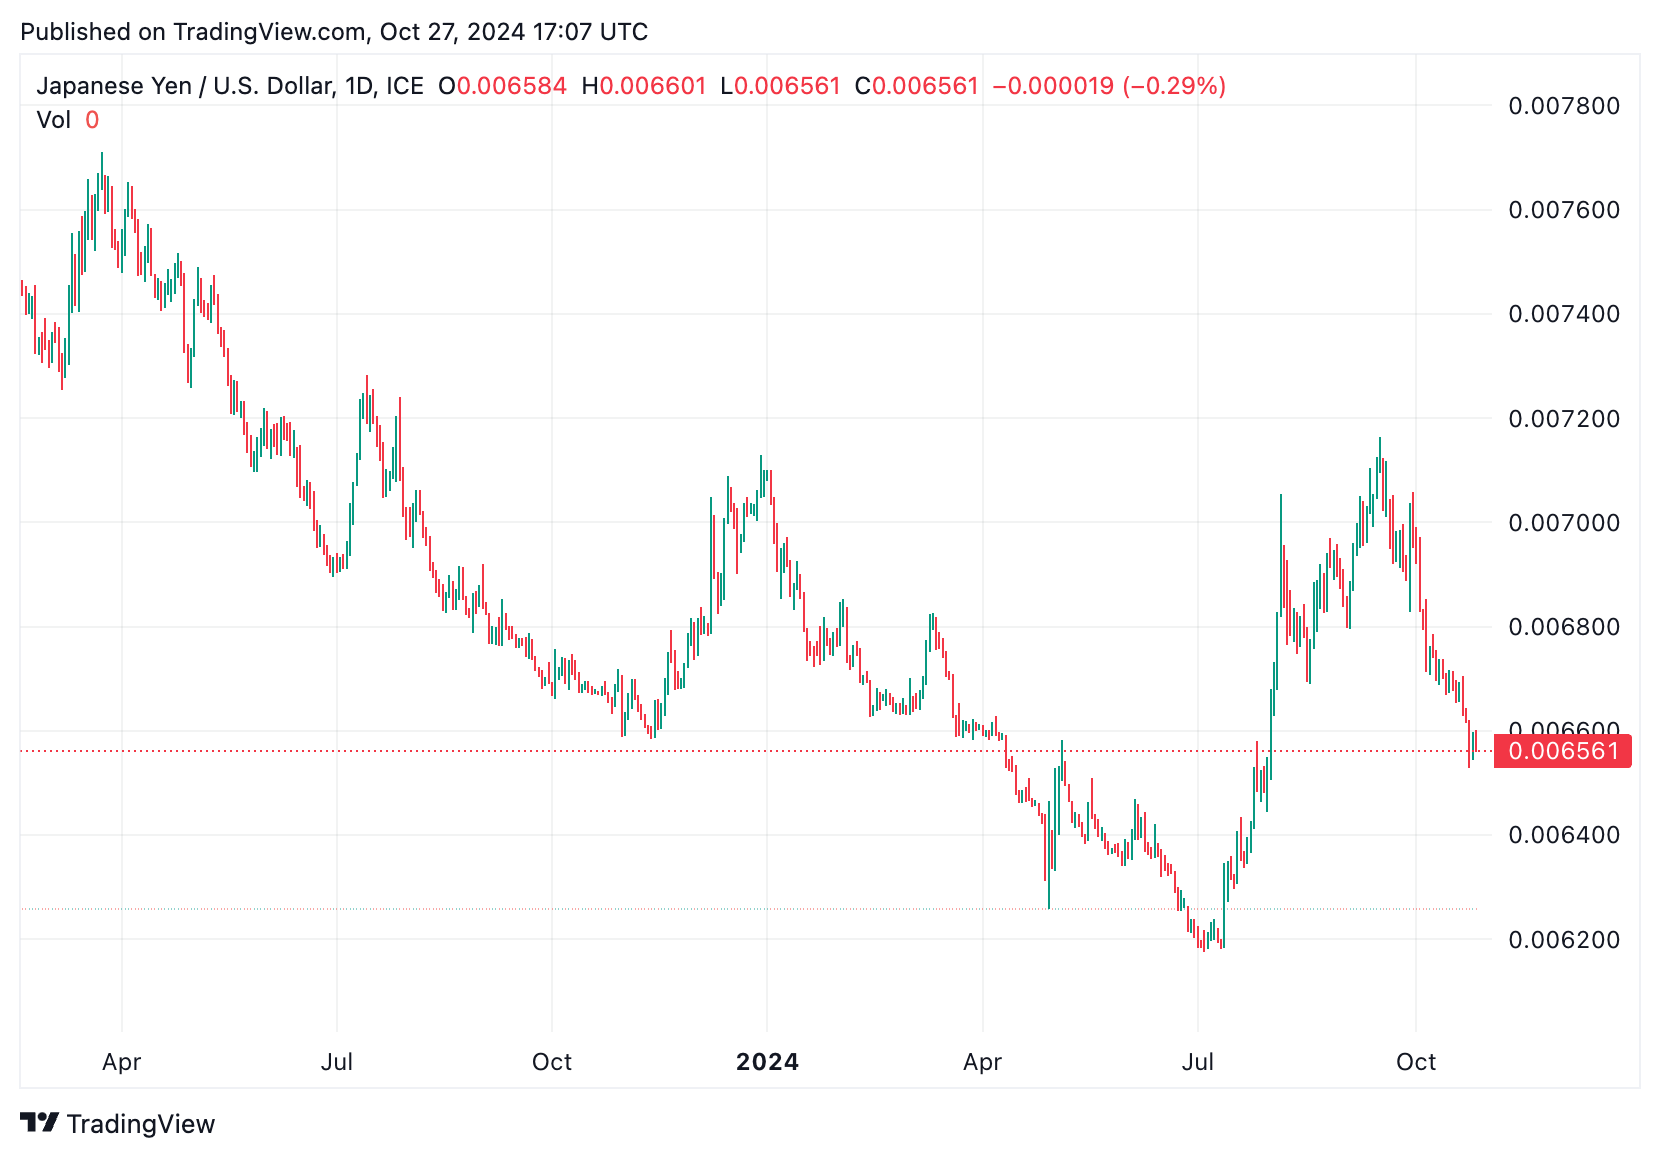
In unison with the widening rate gap, the Japanese yen experienced a historical weakening against other currencies. It lost more than 40% of its value against the US dollar from early 2022 to July 2024 and barely did any better against the euro.
Let’s begin with a quick recap of the monetary policies that created the perfect environment for the yen carry trade.
Investors noticed the opportune setup and began borrowing yen at essentially zero cost. They then invested the borrowed money in various assets overseas, converting the yen to stronger currencies in the process.
One of the safest investments was in US treasury bonds which basically provided a “risk-free” yield of 5%. On top of the yield, the US dollar kept strengthening against the yen. This further benefited investors when they later had to “buy back” the yen they had invested in foreign currencies.
Similar opportunities were found in Continental Europe, the UK, and the US. And the trade kept working throughout 2022, 2023, and the first half of 2024. And then, it all came tumbling down.
Carry trades are great as long as they work. And because they’re built on monetary policies and macroeconomic factors that are rather stable, investors can usually spot well in advance when a carry trade is no longer favorable.
The problem arises when the underlying setup changes too rapidly and unexpectedly. That’s what happened to the yen carry trade in the summer of 2024.
Here’s a rough timeline of the events that caused the trade to unwind and the financial markets to tumble.
July 11: The yen gains strength
The yen gained 1.8% against the US dollar and 1.5% against the euro in just one hour. It continued to strengthen by 10% in the following three weeks. Investors who had borrowed yen and converted them to dollars or euros were suddenly facing massive losses. This alone forced many investors in the carry trade to close their trades and cut their losses.
July 11 marked the bottom for the yen as well as the top for the Japanese stock market. The Bank of Japan later confirmed a $36.8 billion currency intervention in July, explaining the sudden and aggressive strengthening of the yen.
July 12: Japanese stocks begin to fall
The Nikkei 225 had peaked the day before and now dropped 2.5% at the open after the previous day’s currency strengthening. It continued to fall more than 10% in 10 trading sessions.
July 31: Japan hikes rates
The Bank of Japan raised interest rates from 0.1% to 0.25%. This came after the BOJ’s historical March hike, the first since 2006 and the end of an 8-year-long period with negative interest rates. The higher rates in Japan made it more expensive to borrow yen, although not by much.
July 31: US rates plummet
The ECB had just made their first rate cut in June with more expected to come. Now, the US Fed projected its own first rate cut coming in September with more to follow.
The 2-year US treasury bond yield had already declined from 4.8% to 4.4% from early July to the 30th but the drop accelerated on the rate cut chatter. The yield fell as much as 16% in 4 days before rebounding on August 5.
The declining “risk-free” yield combined with higher Japanese borrowing costs and a strengthening yen made the yen carry trade less and less interesting.
August 2: Recession fears rise
On August 2, the US nonfarm payrolls report put some fear into the market. Only 111,000 new jobs were created, barely half as many as expected. At the same time, the unemployment rate rose from 4.1% to 4.3% while analysts had expected it to stay unchanged.
This came on the back of some disappointing earnings and reports about Warren Buffet selling stocks at a record level. Buffet moving into cash is typically not what you want to see as an equity investor.
A much stronger yen, higher rates in Japan, and lower rates in the US, UK, and eurozone had suddenly broken the yen carry trade. Increased recession fears put further sell pressure on the financial markets.
The Japanese stock market had already fallen 10% through July. But the real crash came in early August. And not just in Japanese equities.
August 4: Crypto crashes
Japanese futures opened up with massive losses on Sunday evening. As one of the few liquid markets trading on weekends, crypto took a big hit as investors scrambled to raise funds and prepare to cover their losses on Monday.
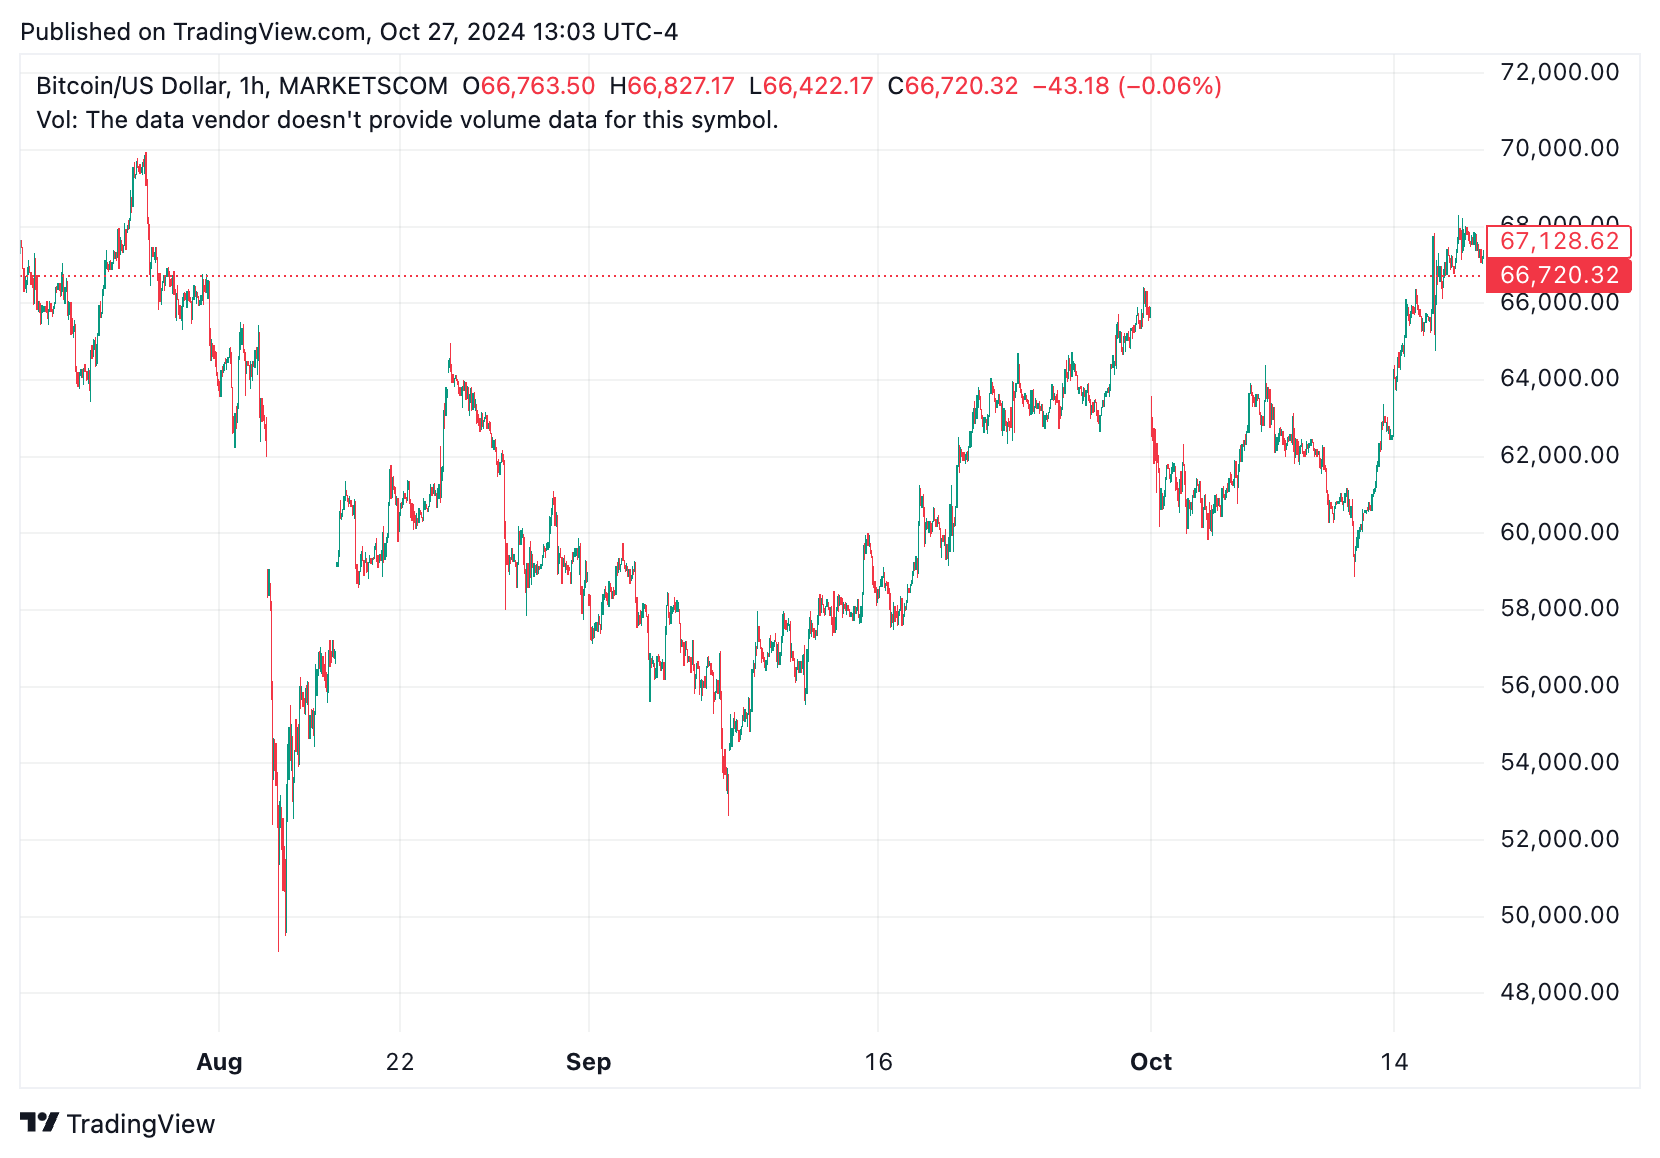
Bitcoin fell 4.2% after having already dropped more than 7% the two days prior. Smaller coins fell even more.
August 5: Markets plummet around the world
The real crash took place on Monday, August 5. Asian markets opened up first with the Nikkei 225 seeing its biggest one-day decline since Black Monday in 1987, plummeting 12.4%. This came after a 5.8% drop on Friday and extended the index’s loss to 25% since the July 11 peak.
Next up, European stock markets took a nosedive. The broad STOXX 600 fell as much as 3.6% at the lows on Monday. It corrected throughout the day though, closing down 2.2%. It had already dropped 2.7% on Friday.
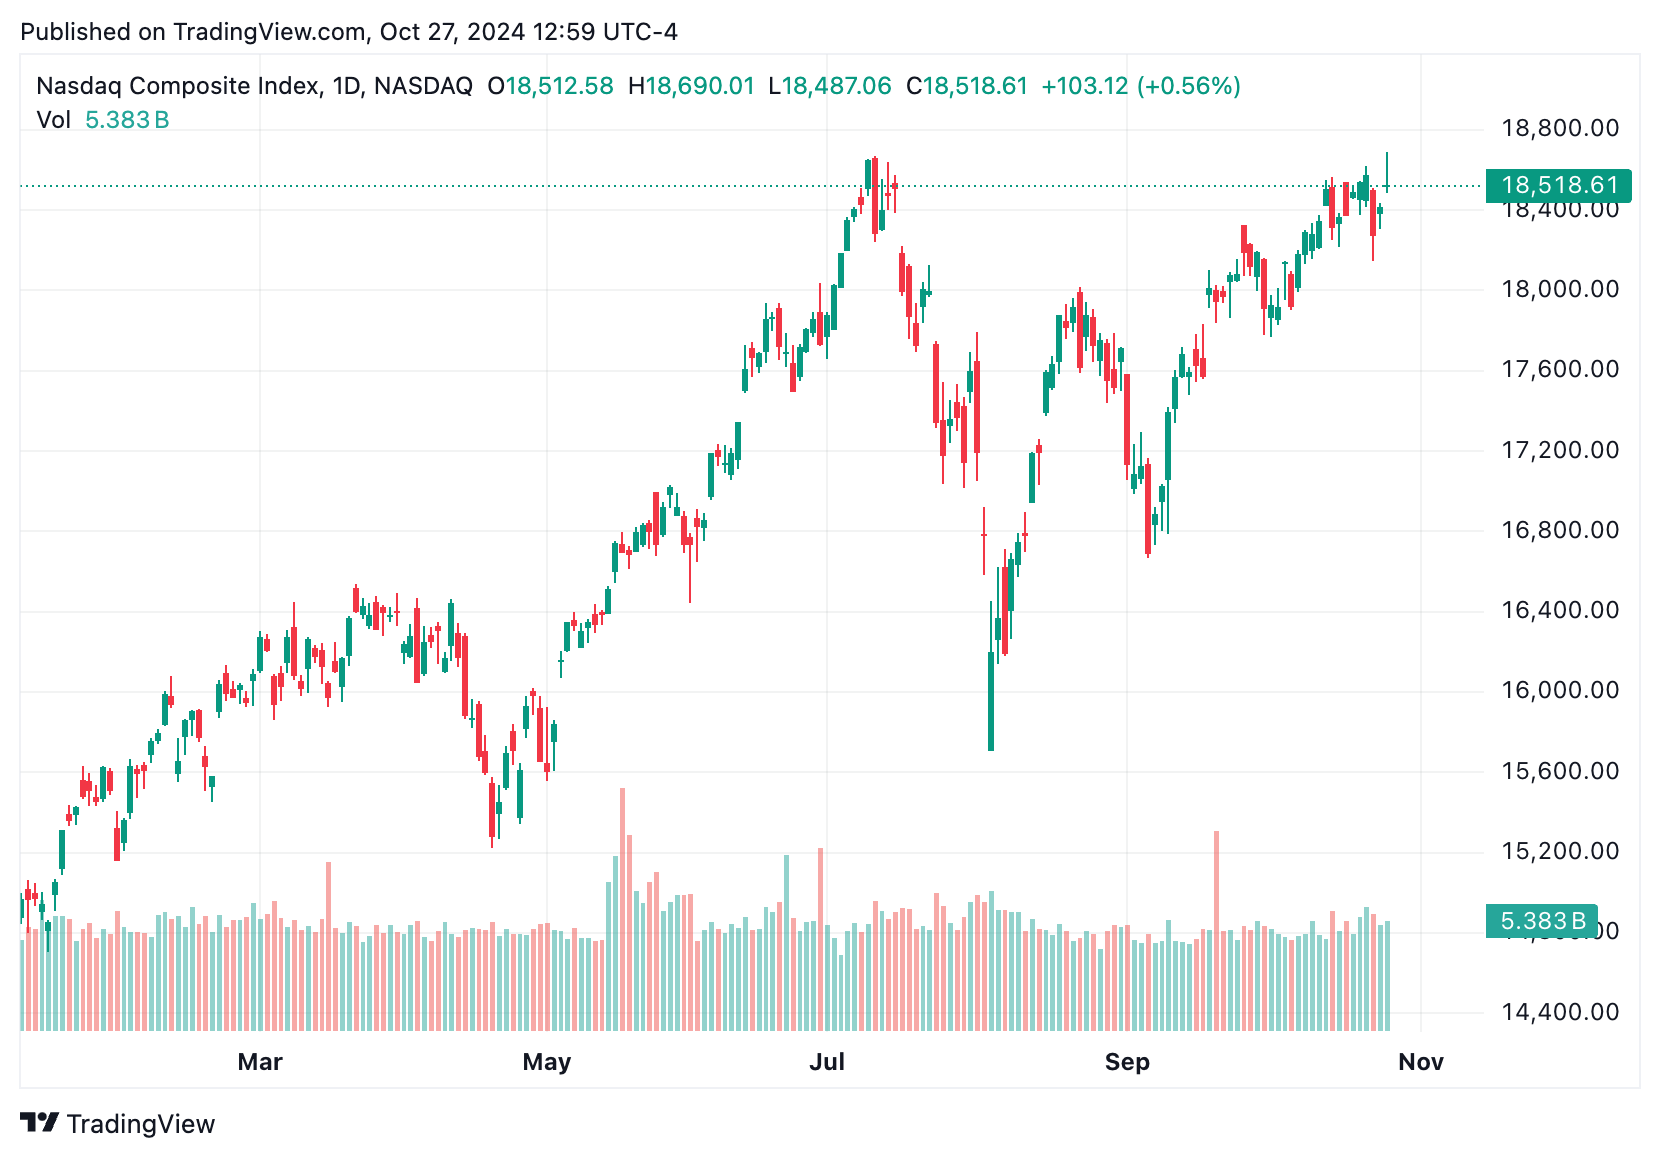
US markets were even more volatile. The Nasdaq Composite was down 6.5% at the open but closed down “only” 3.5%. The S&P 500 closed 3% lower.
The crypto market had already crashed more than 15% the prior week but extended its losses by another 15% on Monday. Bitcoin went as low as $49,000 after having touched $70,000 a few days prior.
Perhaps the wildest swing was observed in the VIX, a measure of equity volatility. After having been mostly steady between 12 and 15 throughout 2024, the VIX spiked to 65 on August 5. This was higher than during the dotcom crash and has only been surpassed twice in history: During the Great Financial Crisis of 2008 and the Covid crash of 2020.
With the VIX at such a high level, it suddenly became too expensive for investors to buy volatility as a hedge against a market downturn, further forcing them to sell out of assets like equities, crypto, etc.
Luckily, the crash didn’t last long.
The market already started recovering during the day on Monday, August 5.
BTC, ETH, and SOL had rebounded 10%, 14%, and 17% respectively as of midnight UTC on Monday. The market continued to rally to close the week essentially unchanged.
US and eurozone equities showed a similar pattern, rallying throughout the week to close virtually flat for the week.
And then there was Japan where it all started. After seeing its biggest drop since 1987, the Nikkei saw one of its best on Tuesday when it rallied more than 10%. It still closed down 2.5% for the week, but that felt like a big win considering how it started.
Markets continued to recover in the following weeks. It only took the STOXX 600 and S&P 500 four weeks to reach new all-time highs.
And just like that, everything seemed to be back to normal. Except for the yen which continued to strengthen against the euro and the dollar. This put a dampener on the yen carry trade. At least for a while.
The yen carry trade is back on with many of the components near their pre-unwinding levels. The yen has weakened significantly in recent weeks while US treasury yields have rallied.
Furthermore, the Bank of Japan has stated that they’re in no rush to hike interest rates and will be careful not to cause instability in the financial markets.
With this setup, there’s no reason to believe that investors won’t build up the yen carry trade to levels where it once again becomes unsustainable. But investors and analysts are definitely more aware of the risks now. Time will tell if the August experience will actually impact investors’ behavior.
Liberation Day, uplifting economic data from the US, and cooling eurozone inflation

Liberation Day tanks equities across the globe while crypto shows rare outperformance in risk-off environment
Trump slaps tariffs on autos while US inflation runs hot and consumer sentiment tanks